Data Interactions
A series of exploratory studies in a Smart Building
2019-2021
Human-Building Interaction, Human-Centered Smart Buildings, Mixed Methods, PhD, OpenLab
My PhD work focused on understanding existing pitfalls with smart buildings from a human angle, to inform the design of responsive environments that bring value to their residents. Following a human-centered design approach and focusing on a specific smart office building, I did a series of exploratory studies involving building occupants - including focus groups and design fiction workshops - to understand existing complexities, and their views and perceptions on data collection and use in the building, and frame the design space for possible solutions. This early design exploration phase was followed by mixed methods research approaches (i.e. qualitative and quantitative data analyses) to unpack relationships with sensory data, perceived environmental conditions and wellbeing in the built environment.
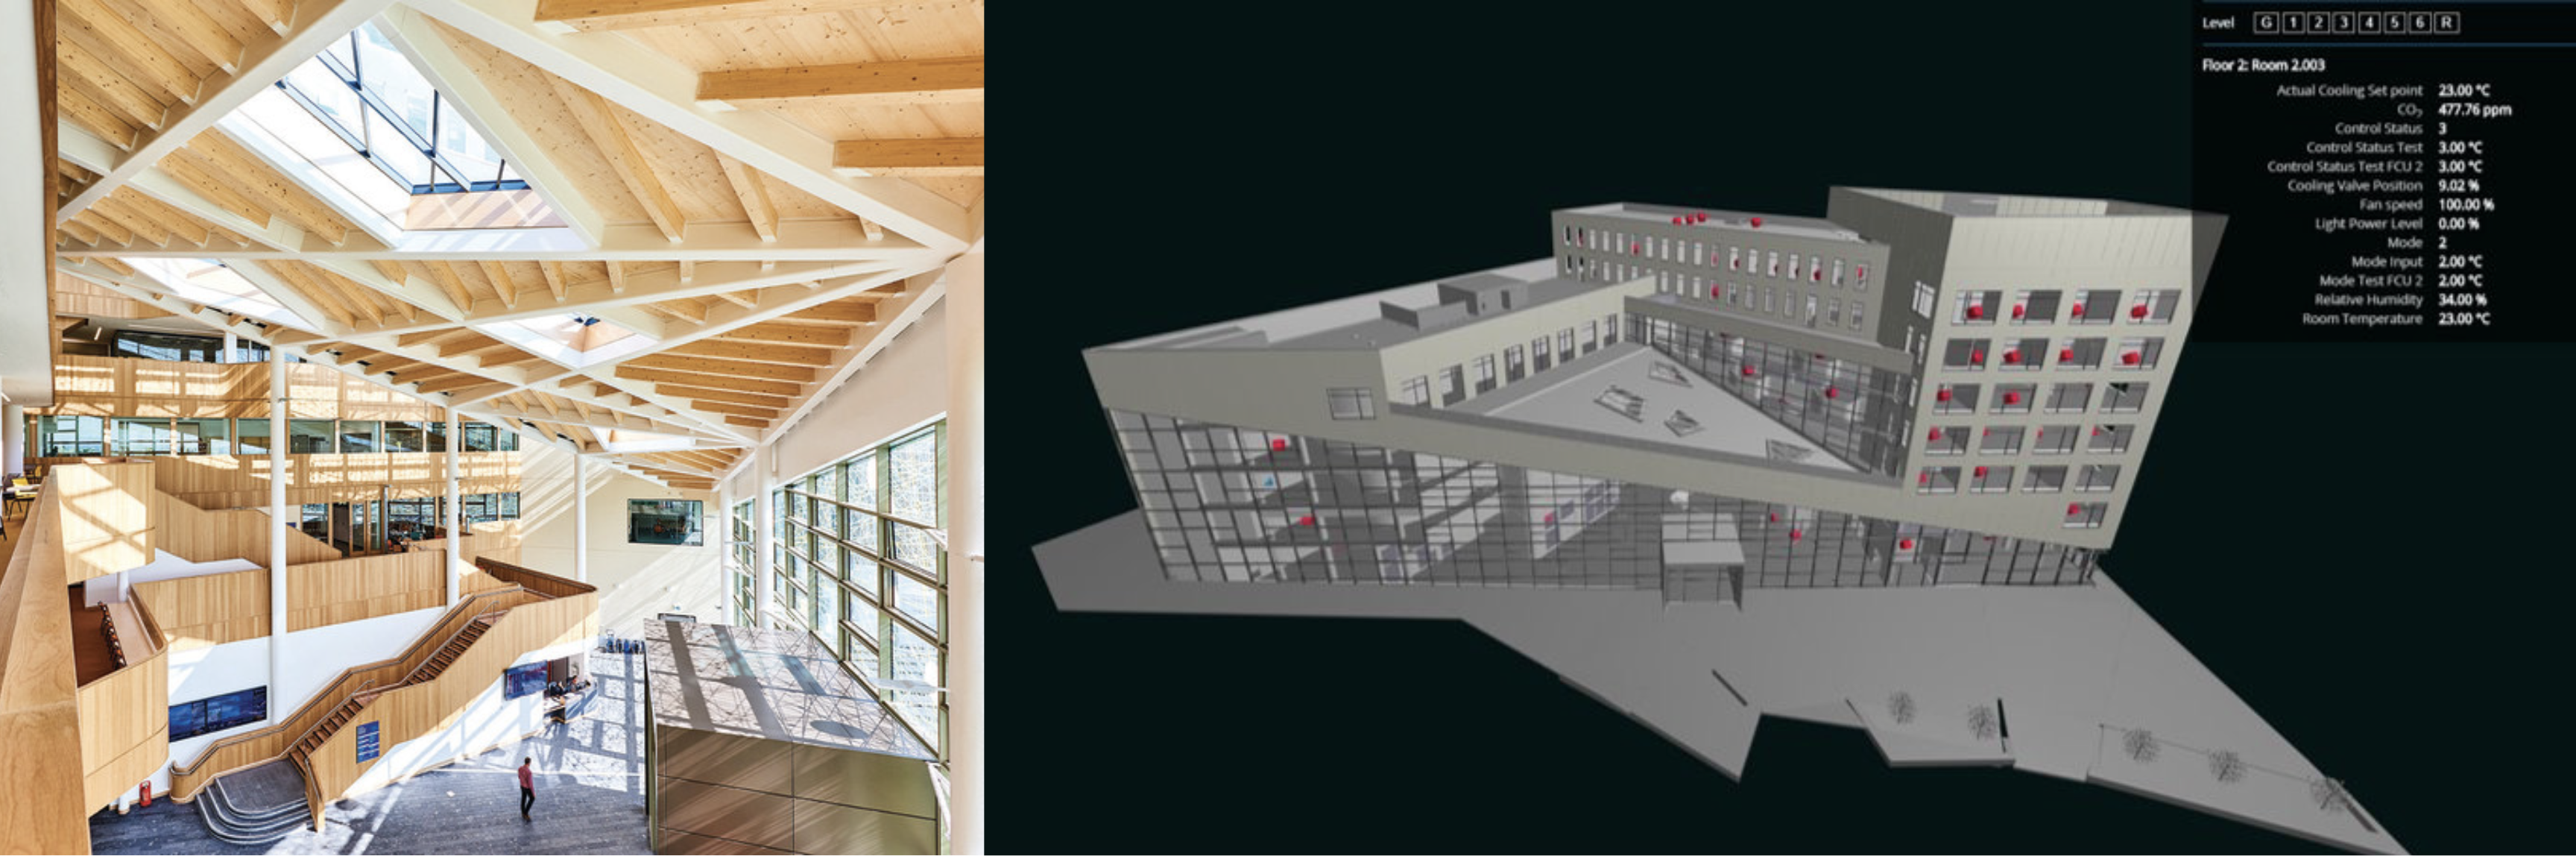
Two publications have been produced from this series of studies. The first focuses on unpacking how the building occupants perceive data collection and use within the smart building - particularly how data is used to improve wellbeing - and speculating on design solutions in that utilize data differently. The paper frames a design agenda for improving smart building’s occupant experiences and increasing the perceivability, accessibility, and usability of data in such buildings - published in the ACM CHI 2023 conference proceedings, see publication.
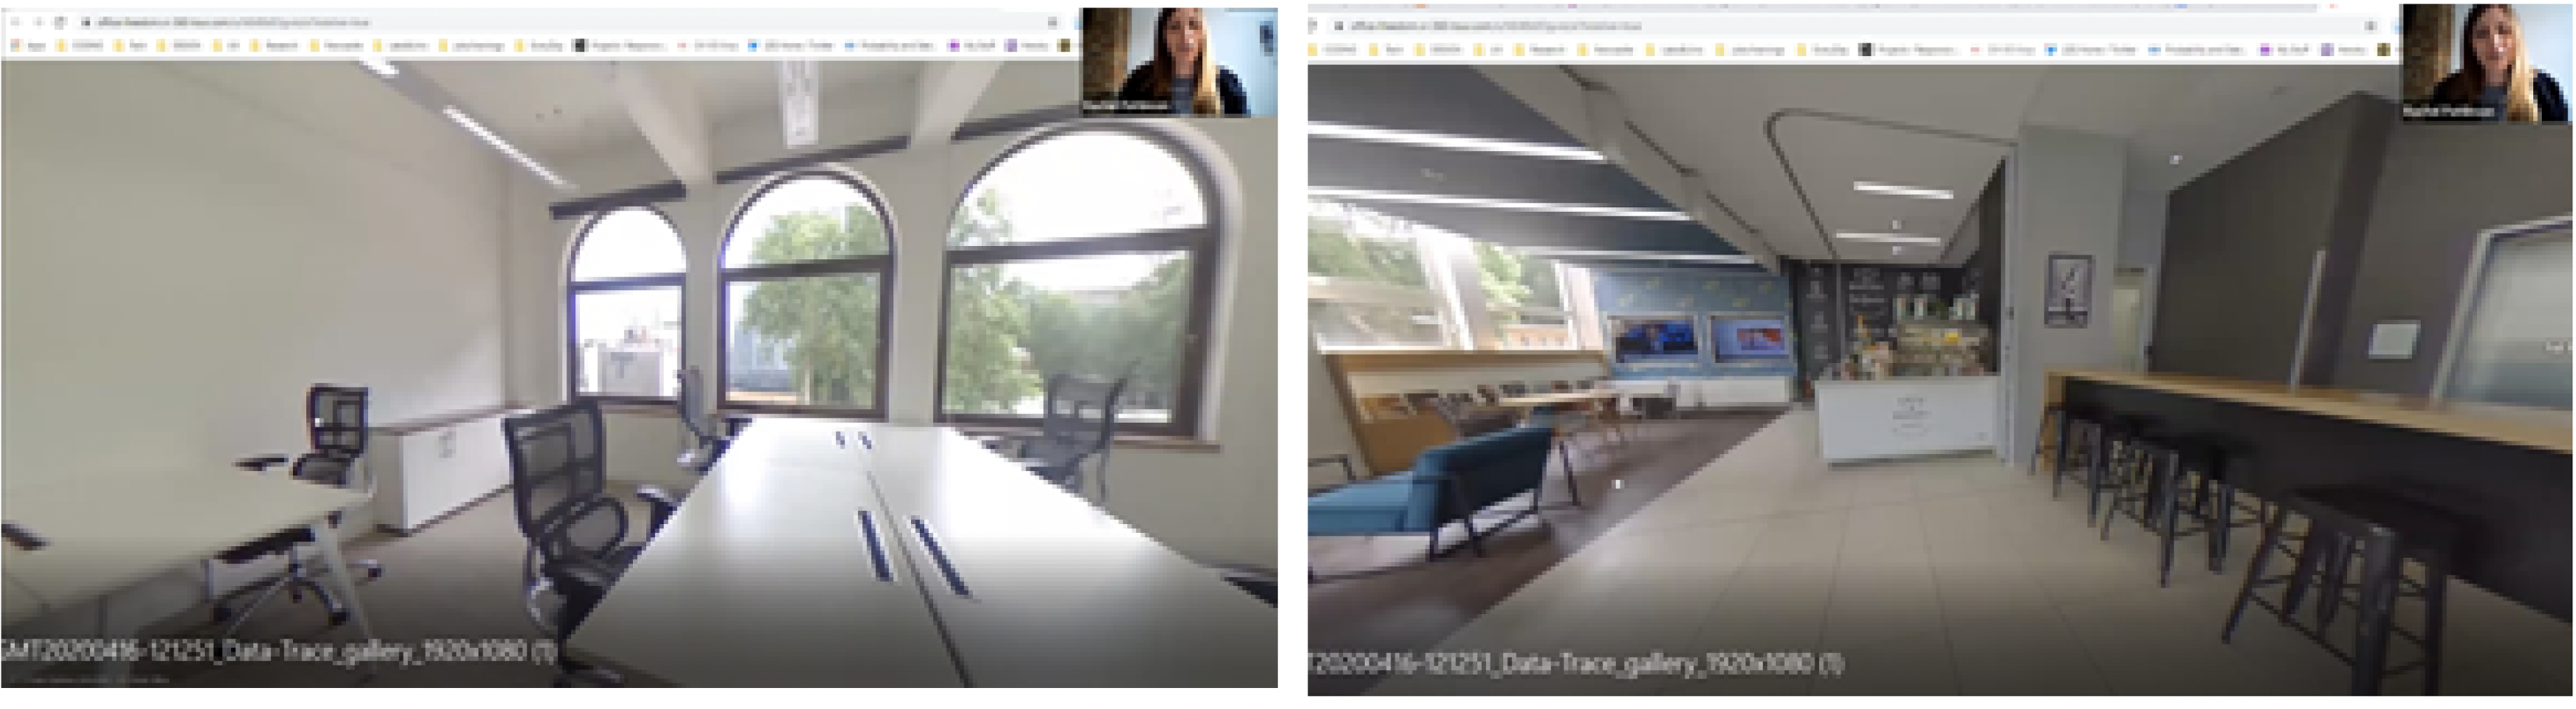 Above: Design Fiction Workshop - Participant speculating about alternative uses of data in smart buildings through 360 images. The participant envisioned an app whereby all building sensory data are processed to provide recomendations on where to work based on personal preferences / task needed to accomplish - e.g. the most quiet place in the office etc.
The second one focuses on unpacking correlations between wellbeing (self-reported data), perceived environment (e.g. noise, light, temperature) and sensory data (obtained by wearable devices) over a period of remote working (due to COVID-19) - published at Frontiers of Computer Science, see publication.
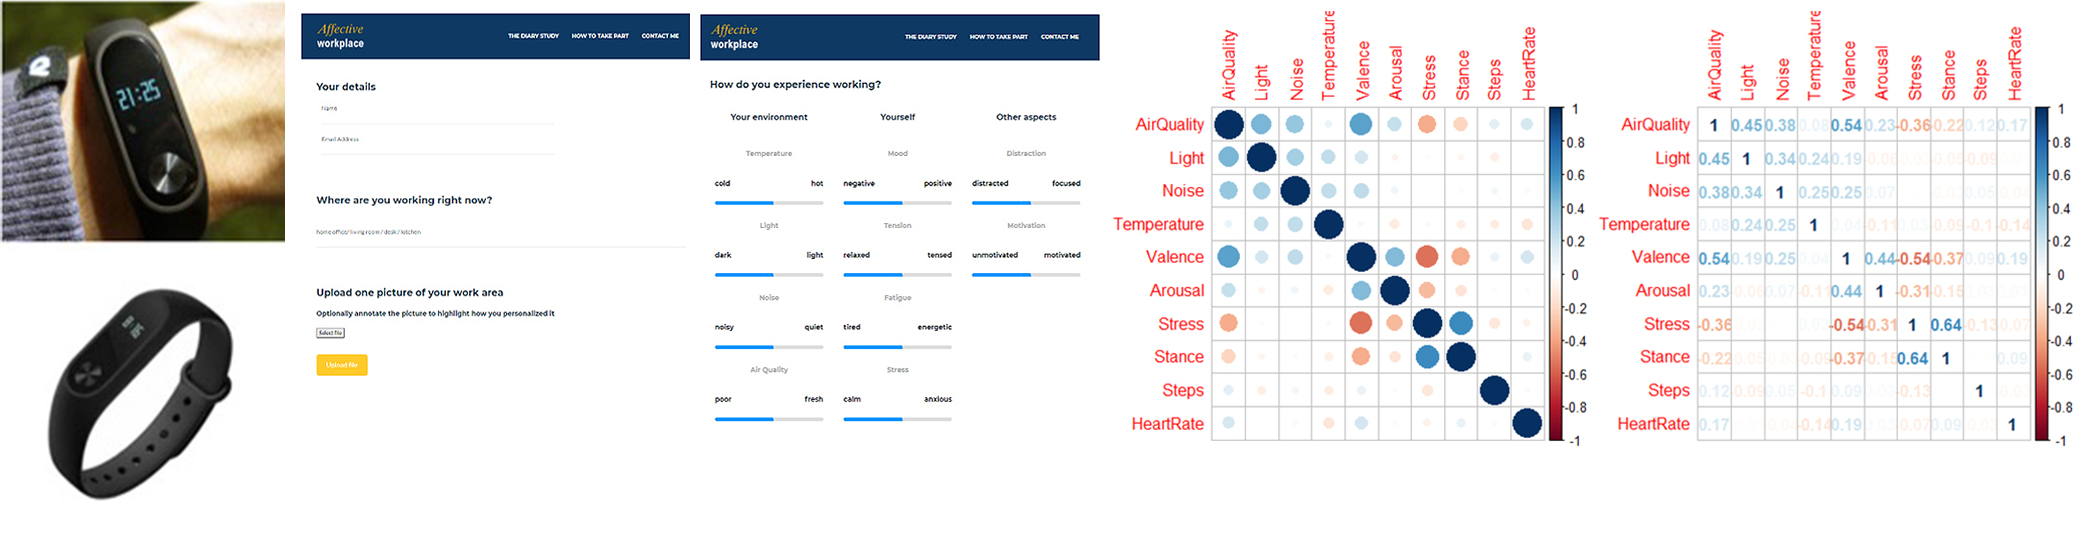 Above Left: Wearable and custom web app used for data qualitative and quantitative collection. Above Right: Correlations Plot between key self-reported wellbeing and environmental data.