GenAI Workflows
Co-designing Characters and Storyboards with GenAI and people with Parkinson's
2024-2025
Prompt Engineering, Human-AI interaction, Digital Health, Storyboarding, TORUS project
As part of EPSRC-funded TORUS project and while doing research within digital the health domain, I co-produced GenAI-generated characters and developed interactive storyboards (using Figma) as a tool for conducting internal and external research within the project.
The TORUS project develops a smart home system for at-home monitoring of Parkinson’s disease, comprising vision-based cameras for posture recognition and a wearable band.
The purpose of the storyboard tool and the associated studies was to support internal collaboration - engaging with engineers within the project to discuss and coordinate product development - as well as external user research - investigating the acceptability and appropriateness of different interaction options with participants, and unpacking ethical concerns around privacy, use and development of AI algorithms and data collection, processing and use.
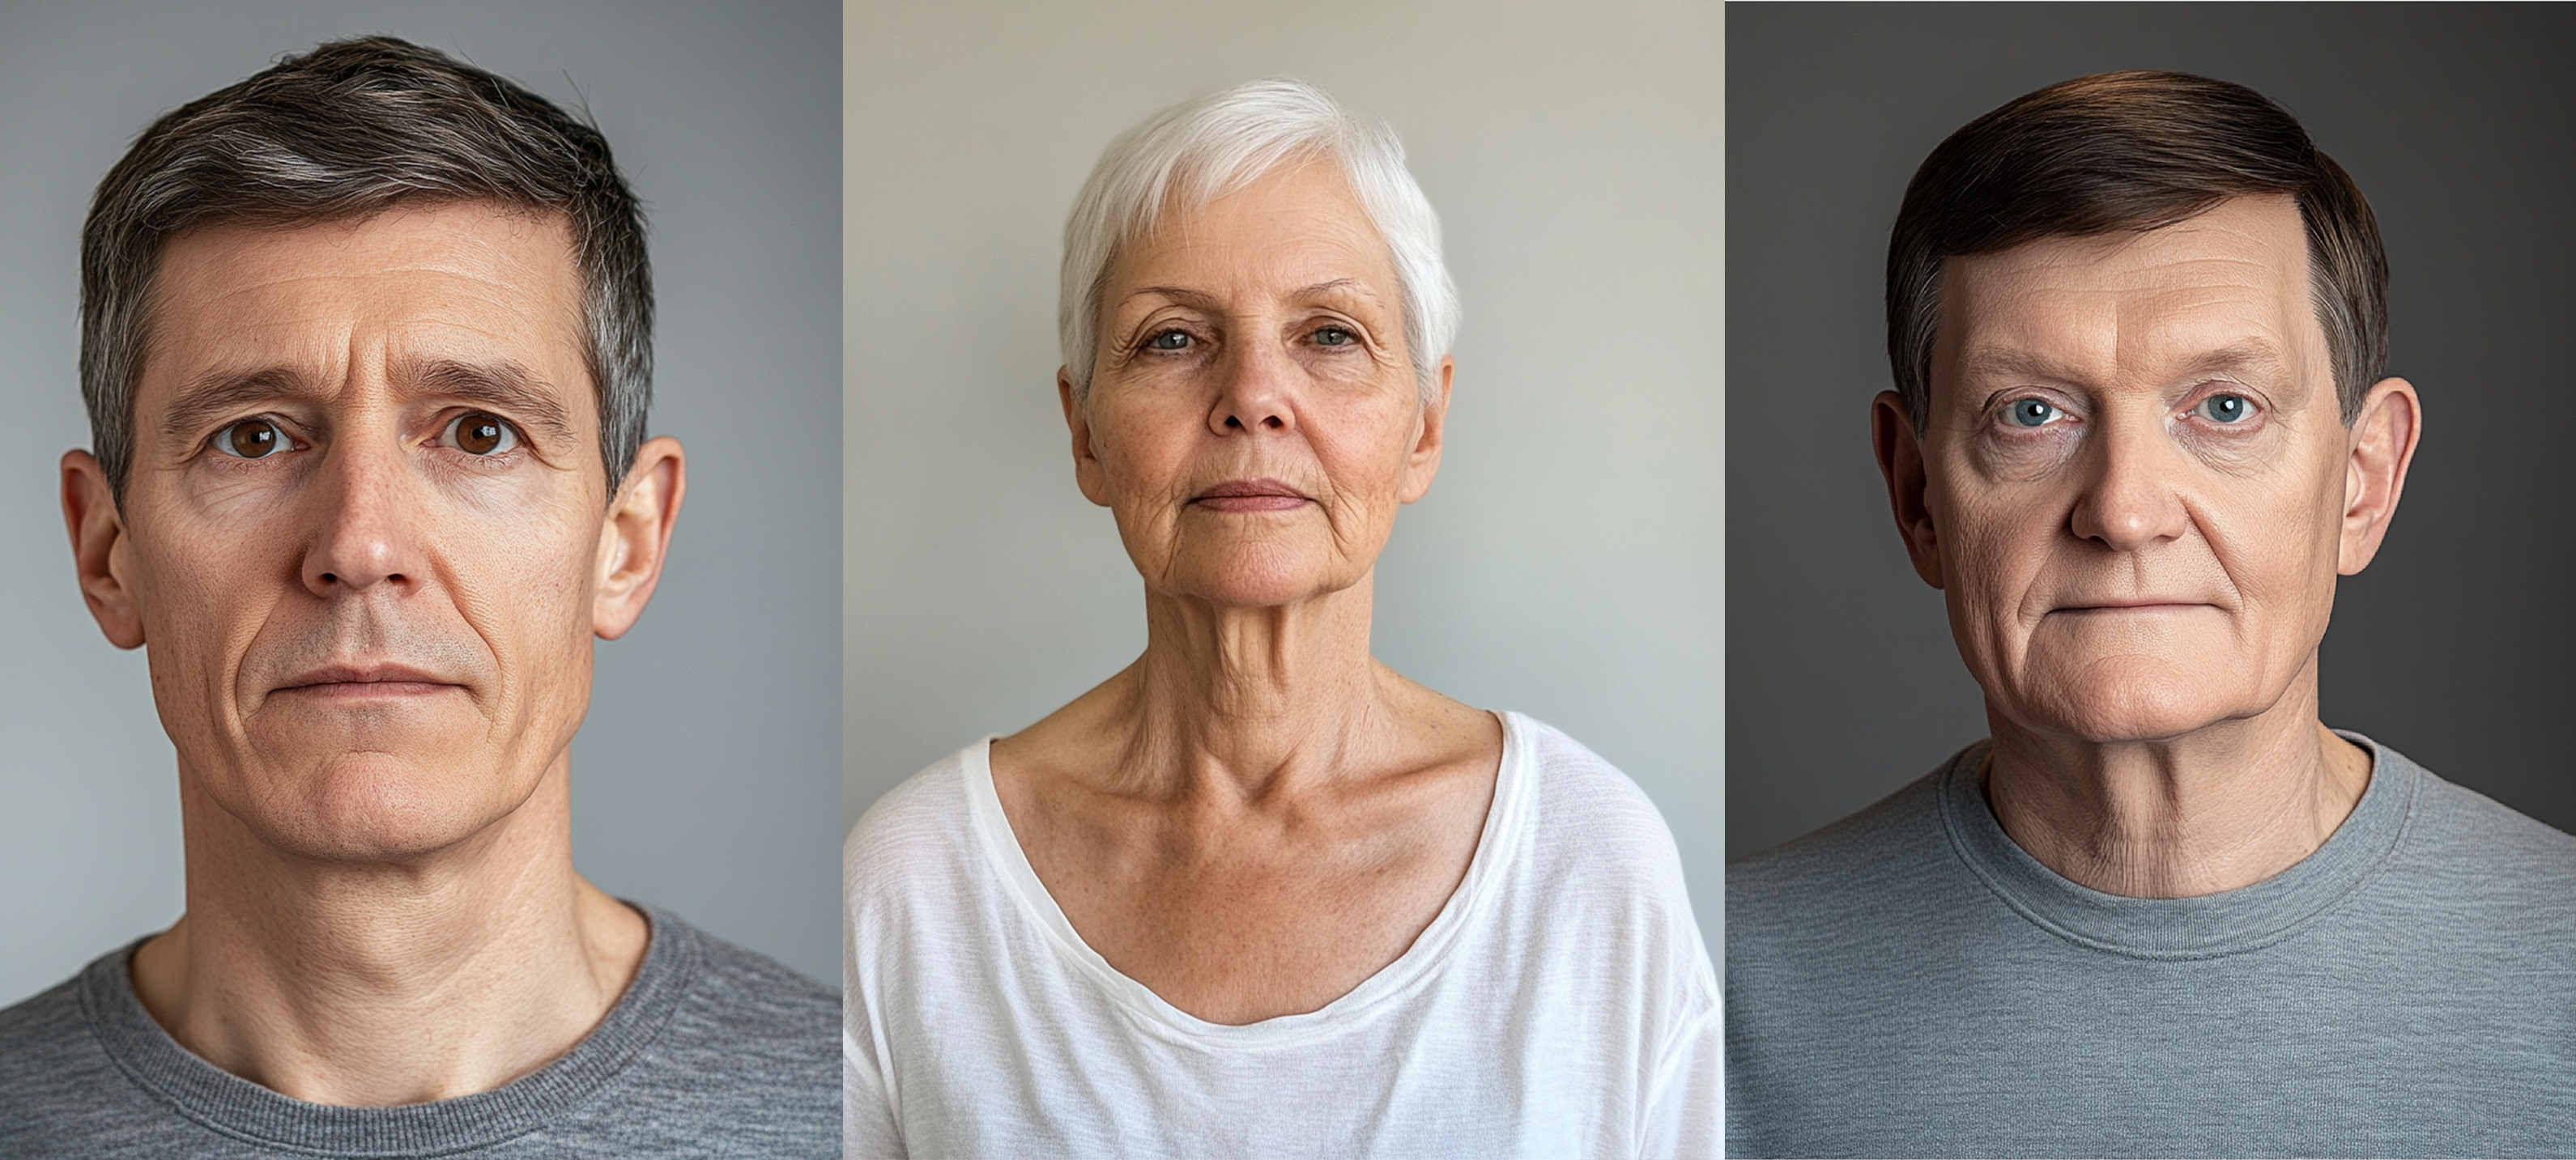
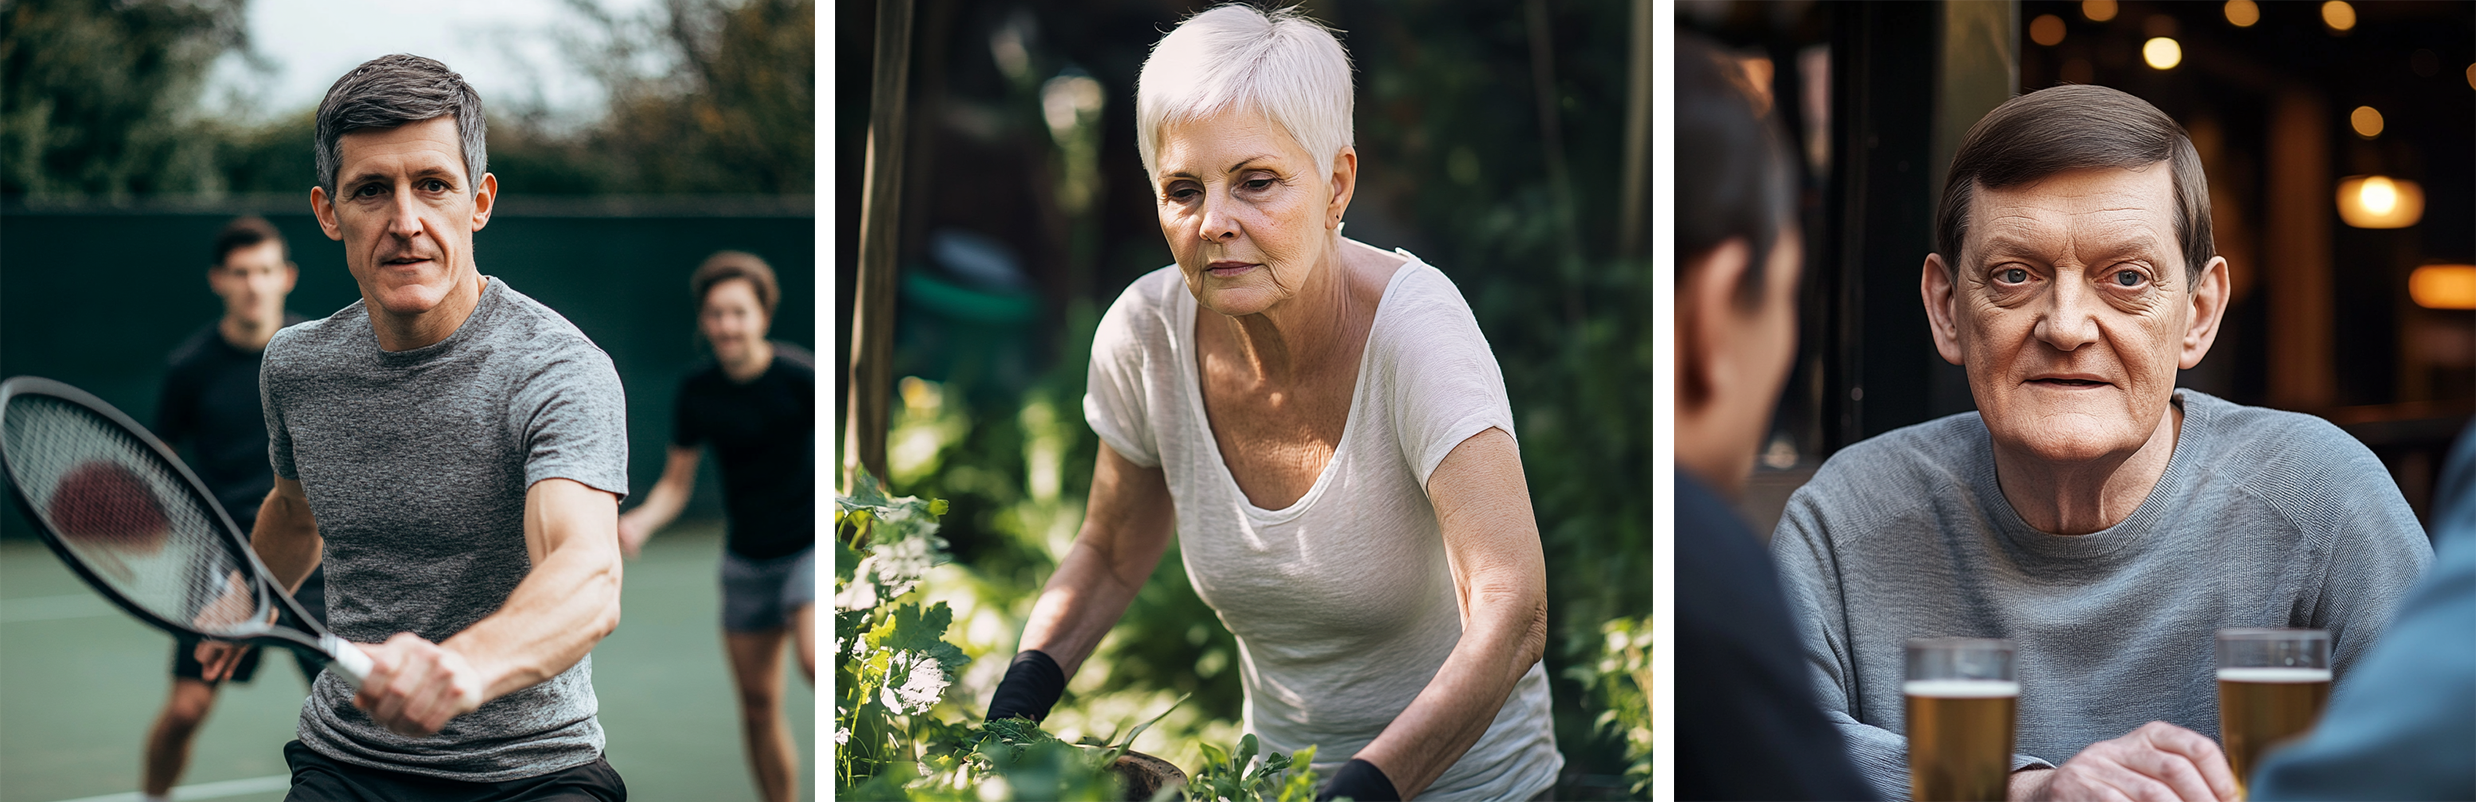
The Gen AI characters
Through a series of workshops, I involved people living with Parkinson’s in co-designing three GenAI characters (personas) using the platfom MidJourney. This exercise was to ensure that their values and experiences are better reflected, and that the resulting characters were accurate depictions of people living with Parkinson’s. In total, I generated ~2900 images, with ~103 of them featured in the storyboards.
Myself and my co-authors author a paper (in process), presenting key findings from the three-week design experiment of co-generating the characters with participants, reflecting on key learnings from the design process and unpacking some of the complexities at play in the use of GenAI tools for design workflows.
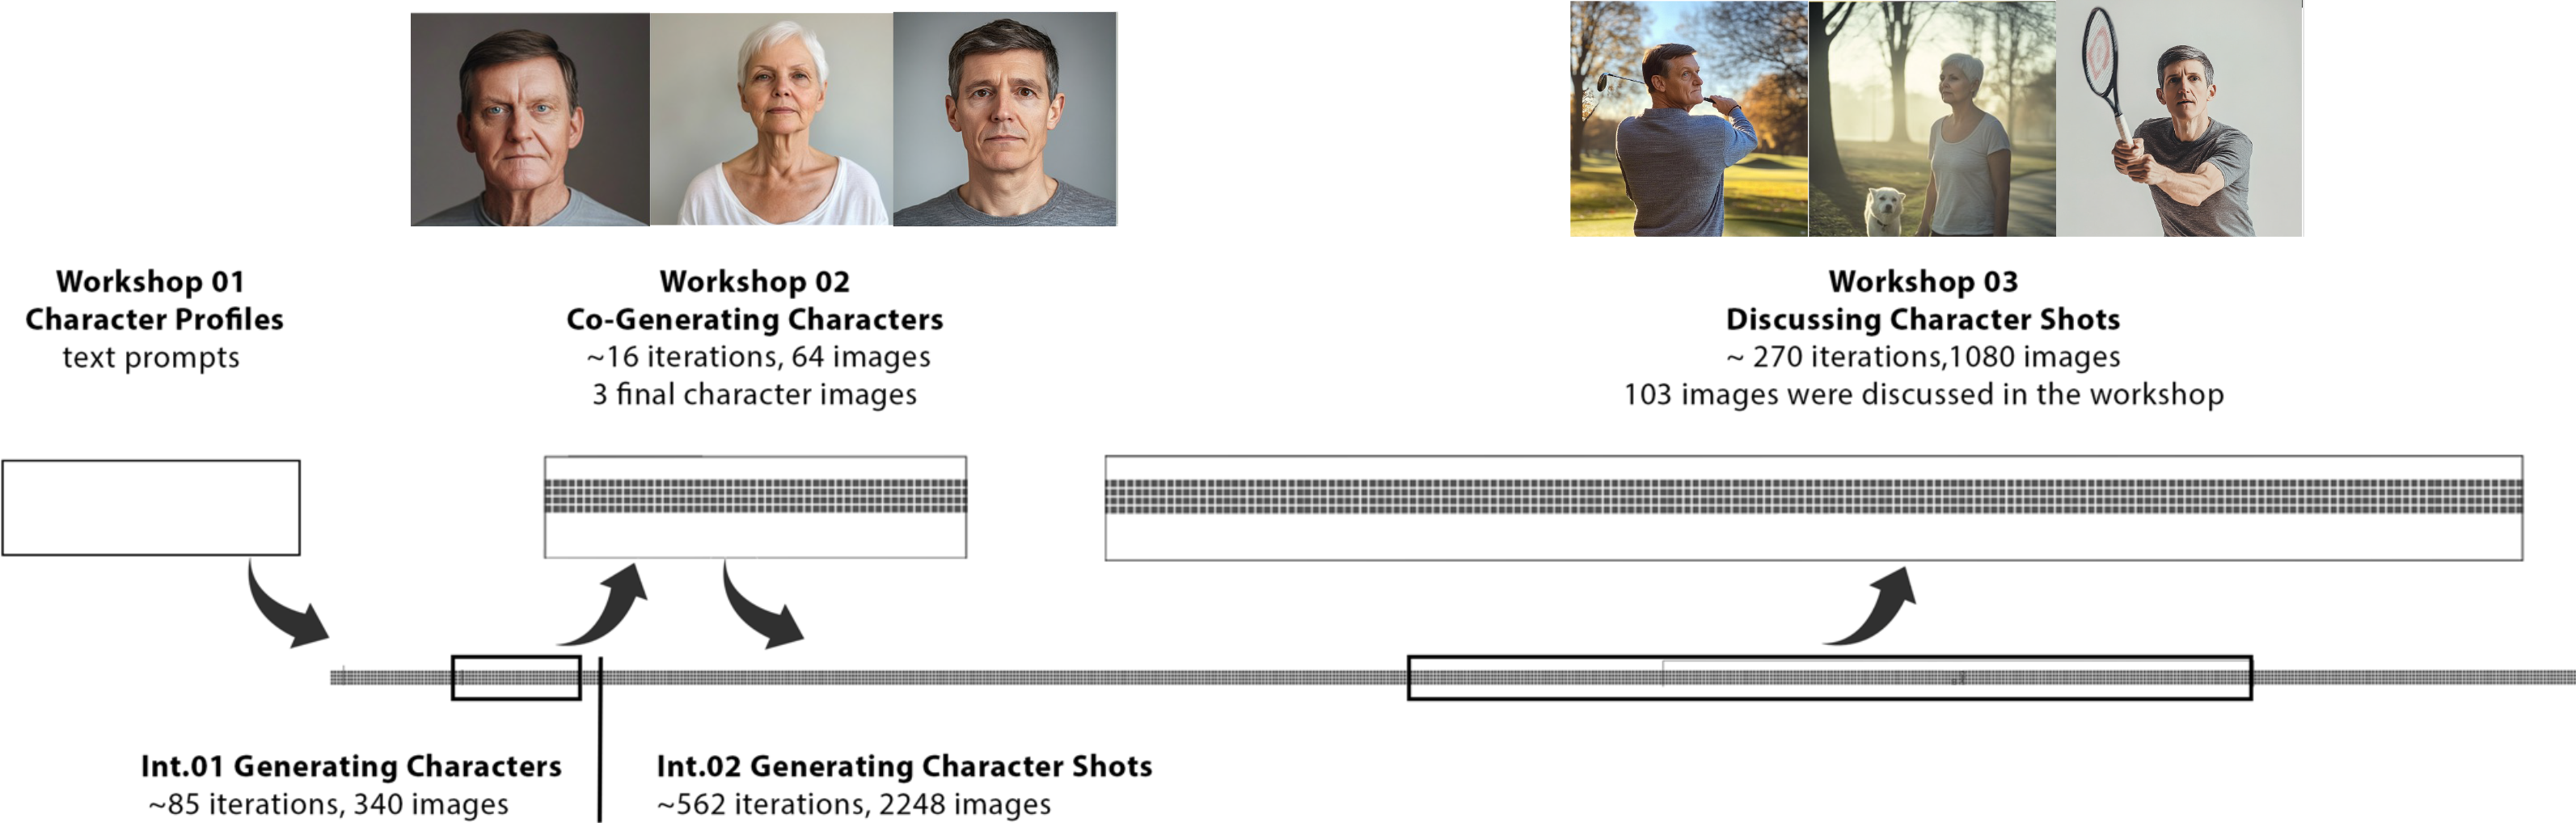
Above: A diagram showing the amount of content generated and key design phases.
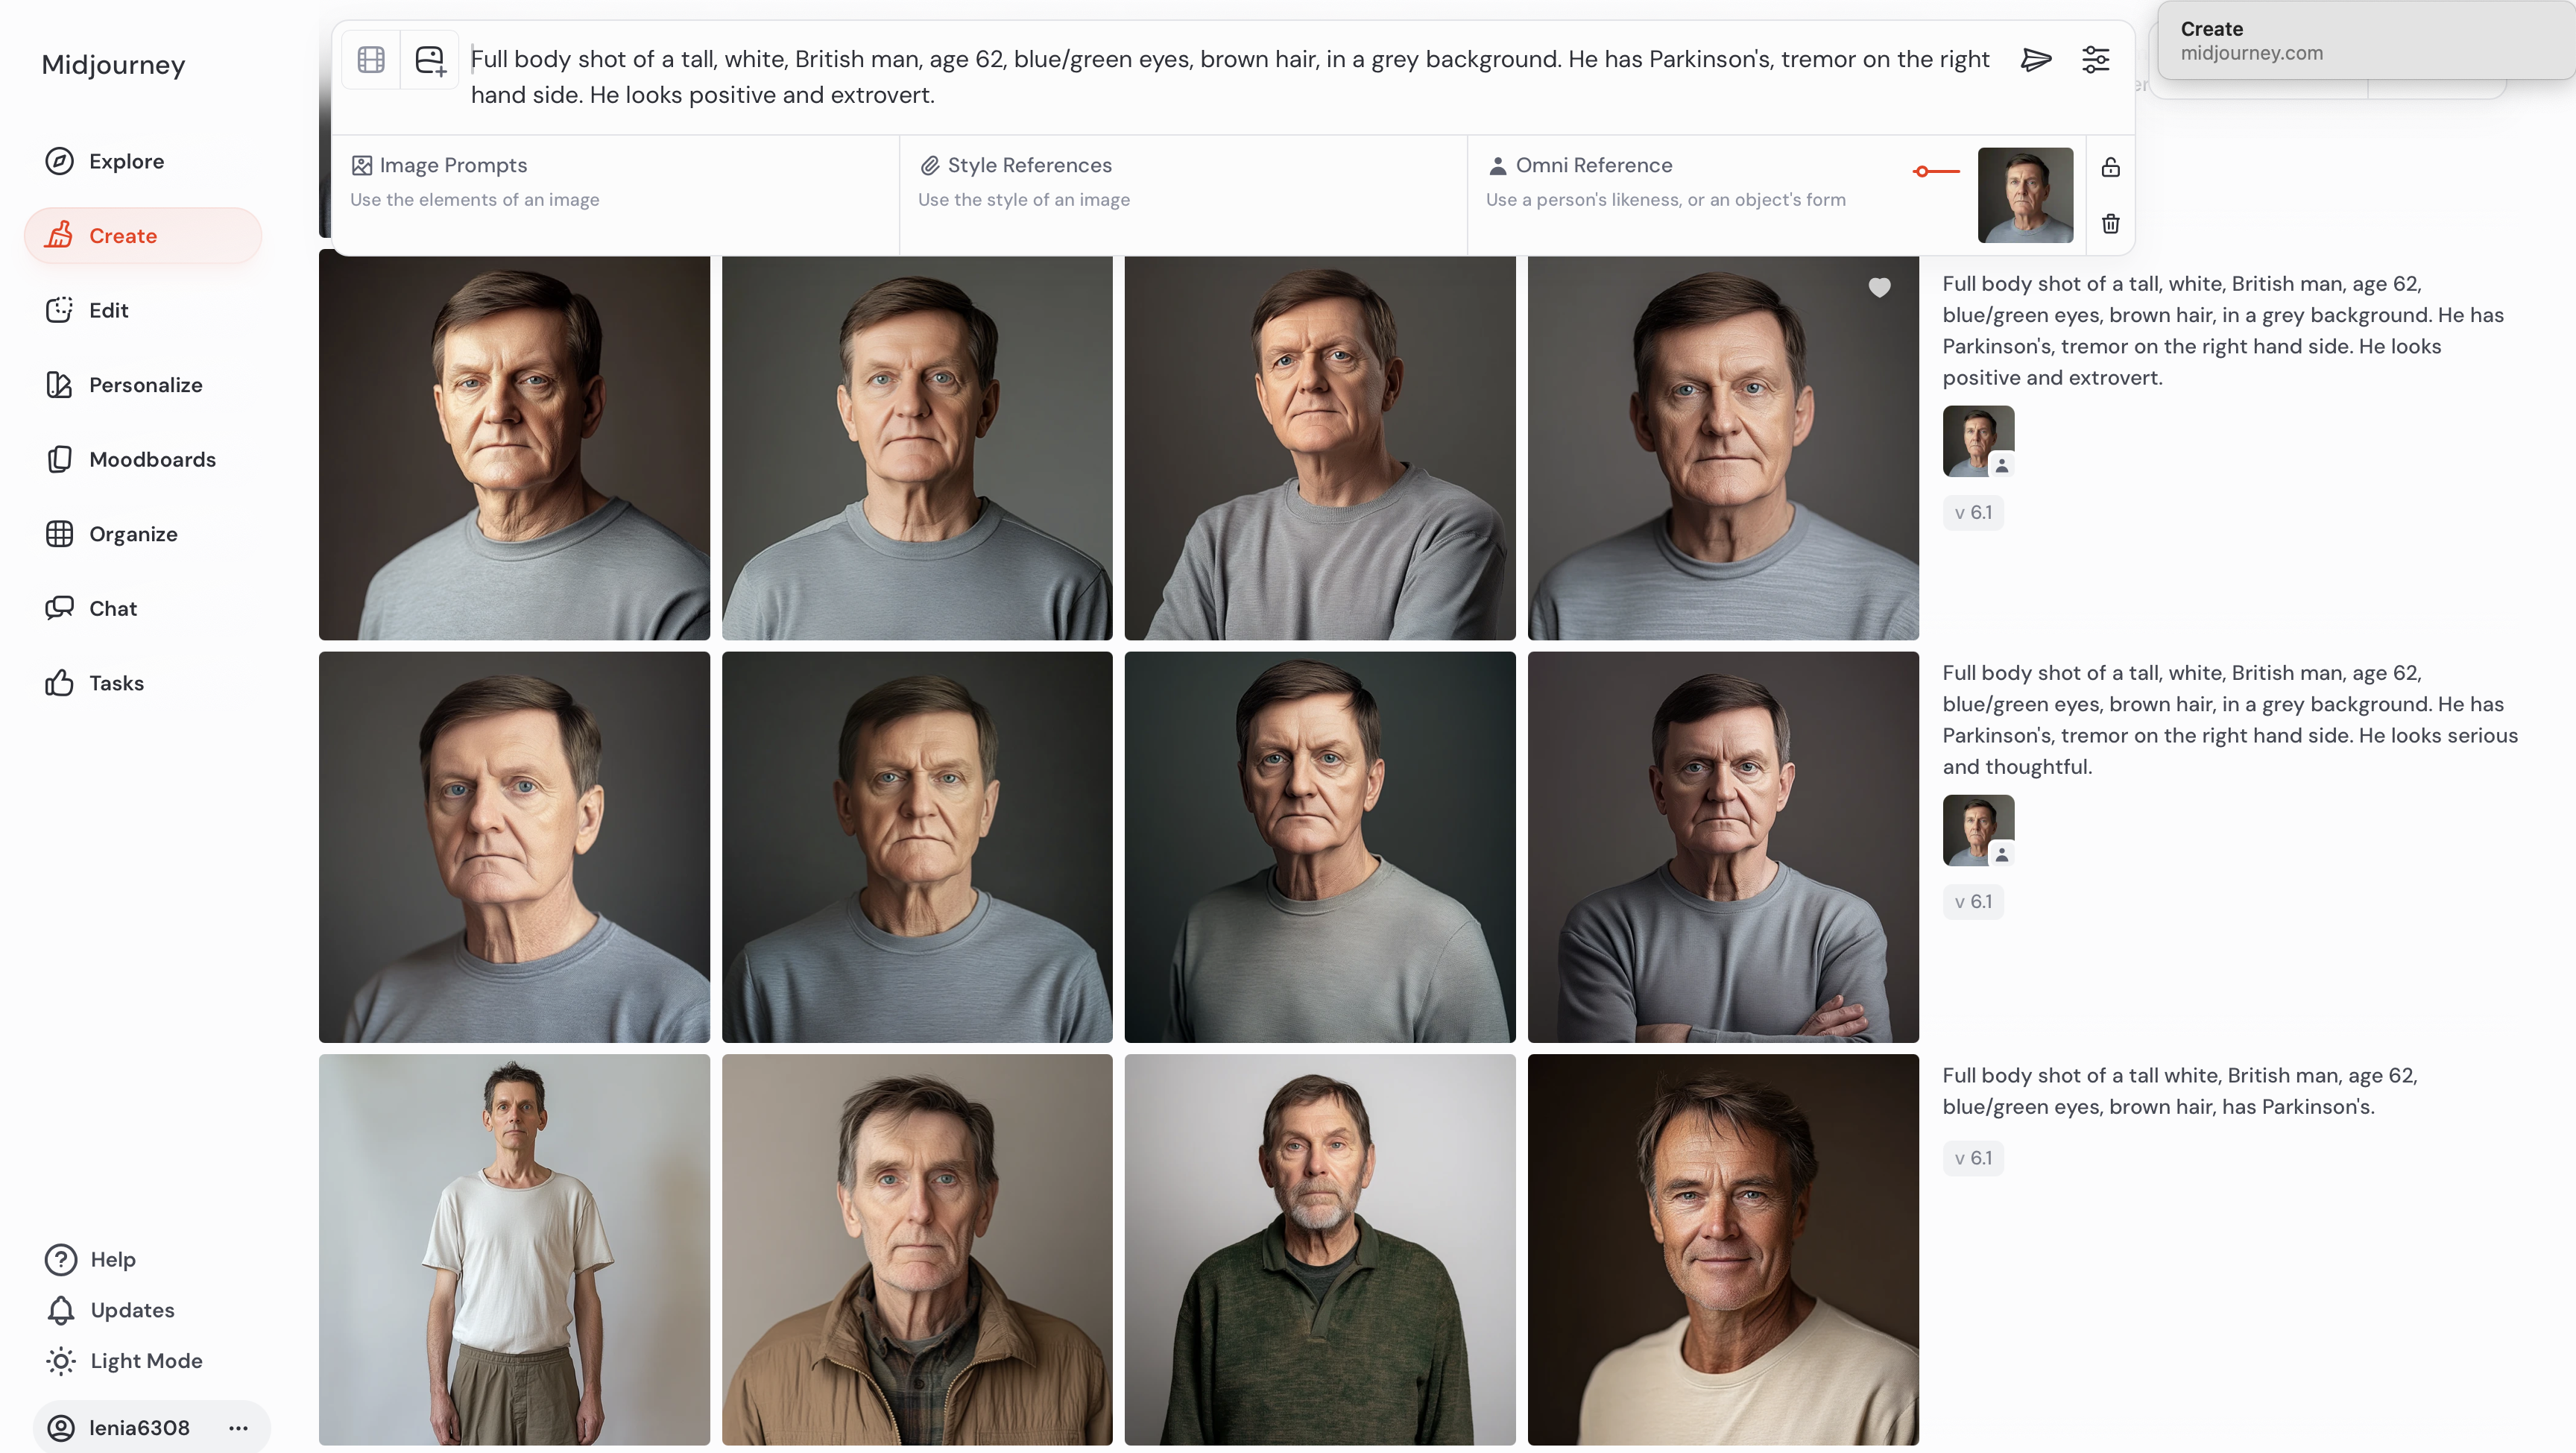
Above: An example of MidJourney prompting exploration.
The Storyboard
The storyboard depicted different potential interaction scenarios for the TORUS system to support internal team meetings and external research (online studies with Parkinson’s patients and carers). These interactions include voice control, wearable reminders, data logging/journaling through smart phone apps etc. Using branching and interactive graphics (in Figma), the storyboard provided participants with different options to choose from - i.e. different options to control and interact with the system - and ways to record and comment on their preferred interactions - i.e. I used integrated survey tools, and Maze to record user flows within the storyboards.
Through iterative engagements with internal and external stakeholders, the storyboard supported handling complexity of the decisions around the system’s design, consolidating feedback from engineers and patients/carers. The use of Gen-AI tool Midjourney made it possible to constantly update the storyboard effortlessly, from producing interaction alternatives worth exploring, to integrating new concepts and keeping everyone in the project up-to-date with the design requirements and the design progress of the TORUS system.
Above: A version of the interactive storyboard (Figma) used as a tool to conduct online studies, investigating interaction scenarios with the home monitoring system. The storyboard was essentially an online survey, whereby one can nagivate different interaction scenarios using buttons and leave feedback on an embedded survey.
Above: Short video-clip showcasing part of one version of the storyboard
In total, the storyboards supported the design of the TORUS project for a period of 6 months. In terms of conducting online studies with external users, we initially interviewed 10 participants using the storyboard tool, and later deployed it as an online survey capturing insights from another 20 participants. Results from these online studies formed design recommendations to guide the design of TORUS smart home health monitoring system.
Above: A PDF report with one of the most final versions of the storyboard, featuring the life-cycle of the TORUS system and accompanied survey questions.